ST ANDREW SOUND AND SATILLA RIVER (Marine Chart : US11504_P255)

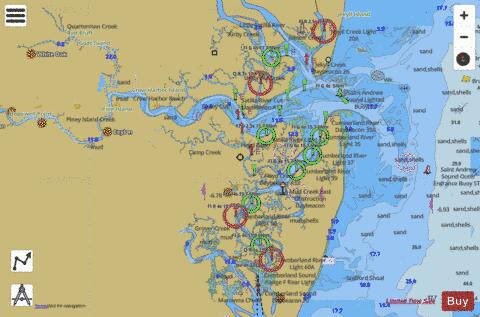
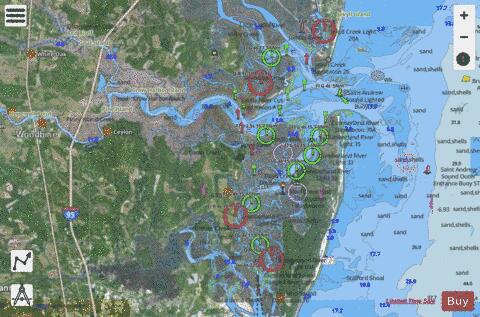
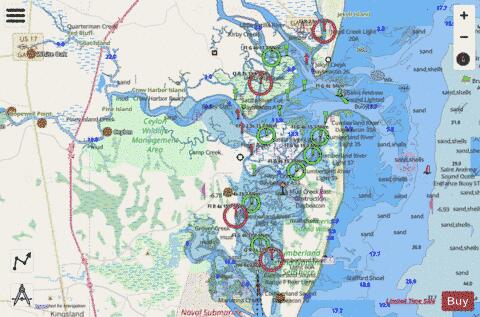
ST ANDREW SOUND AND SATILLA RIVER marine chart is available as part of iBoating : USA Marine & Fishing App(now supported on multiple platforms including Android, iPhone/iPad, MacBook, and Windows(tablet and phone)/PC based chartplotter.).  


 When you purchase our Nautical Charts App,  you get all the great marine chart app features like fishing spots, along with ST ANDREW SOUND AND SATILLA RIVER marine chart. The Marine Navigation App provides advanced features of a Marine Chartplotter including adjusting water level offset and custom depth shading. Fishing spots and depth contours layers are available in most Lake maps. Nautical navigation features include advanced instrumentation to gather wind speed direction, water temperature, water depth, and accurate GPS with AIS receivers(using NMEA over TCP/UDP). Autopilot support can be enabled during ‘Goto WayPoint’ and ‘Route Assistance’. Now Automatic Slip to Slip Boat routing based Boat's Draft (draught) is available for water mapped by this chart.


Have more questions about the Nautical Chart App? Ask us.


ST ANDREW SOUND AND SATILLA RIVER Stats

TitleST ANDREW SOUND AND SATILLA RIVER
This chart covers part of America’s Great Loop
Scale1:40000
Min Longitude-81.75
Min Latitude30.80
Max Longitude-81.27
Max Latitude31.07
Edition Label 118
Edition Label 21
Edition Label 380
IdUS11504_P255
CountryUS
ProjectionMercator
* some Stats may include nearby/connecting waterbodies
Nearby Tide Station Floyd Creek, 2.8 miles above entrance
Distance from center: 0 km
Weekly High / Low Tide Table
DateDayTimeHeight
12/09Sat05:51 AM224.681H cm
12/09Sat12:11 PM31.033L cm
12/09Sat06:03 PM199.511H cm
12/10Sun12:09 AM13.384L cm
12/10Sun06:39 AM235.827H cm
12/10Sun01:00 PM21.033L cm
12/10Sun06:51 PM203.366H cm
12/11Mon12:54 AM4.834L cm
12/11Mon07:25 AM245.214H cm
12/11Mon01:46 PM11.792L cm
12/11Mon07:37 PM206.83H cm
12/12Tue01:40 AM-3.547L cm
12/12Tue08:10 AM252.246H cm
12/12Tue02:31 PM4.493L cm
12/12Tue08:23 PM209.26H cm
12/13Wed02:25 AM-10.796L cm
12/13Wed08:57 AM256.626H cm
12/13Wed03:16 PM-0.091L cm
12/13Wed09:10 PM210.484H cm
12/14Thu03:10 AM-15.572L cm
12/14Thu09:45 AM258.225H cm
12/14Thu04:01 PM-1.814L cm
12/14Thu09:58 PM210.787H cm

Marine Wind Meteogram for Lake/Chart

For real time, interactive Marine Wind prediction, download App
Date/TimeSpeed *Dir *
12/10 Sun 06:00PM4.528.19
12/10 Sun 09:00PM4.0450.95
12/11 Mon 12:00AM1.580.48
12/11 Mon 03:00AM5.6259.23
12/11 Mon 06:00AM4.49118.09
12/11 Mon 09:00AM5.07114.27
12/11 Mon 12:00PM3.98134.43
12/11 Mon 03:00PM4.06155
12/11 Mon 06:00PM2.51167.64
12/11 Mon 09:00PM2.38176.98
12/12 Tue 12:00AM2.19169.77
12/12 Tue 03:00AM2.64183.47
12/12 Tue 06:00AM2.58183.97
12/12 Tue 09:00AM2.82177.37
12/12 Tue 12:00PM3.04183.86
12/12 Tue 03:00PM4.2216.7
12/12 Tue 06:00PM4.96225.09
12/12 Tue 09:00PM5.32214.08
12/13 Wed 12:00AM4.43204.74
12/13 Wed 03:00AM4.71209.36
12/13 Wed 06:00AM4.65193.89
12/13 Wed 09:00AM5.21195.56
12/13 Wed 12:00PM5.38196.09
12/13 Wed 03:00PM6.34210.8
12/13 Wed 06:00PM7214.89
12/13 Wed 09:00PM6.8209.18
12/14 Thu 12:00AM6.55208.93
12/14 Thu 03:00AM6.65213.43
12/14 Thu 06:00AM6.41213.75
12/14 Thu 09:00AM6.51210.44
12/14 Thu 12:00PM7.32206.02
12/14 Thu 03:00PM7.59209.92
* : UTC Timezone, Speed in meters per sec, and True Direction